Find the Percent of a Number using Benchmark Percentages
Years ago, as a new teacher, I remember one particular day when I asked my class what 5% of 50 was and the variety of answers and calculations I received in response was wide ranging and an eye opener! It certainly highlighted the confusion that students can experience with percentages and that I needed a more tangible and relatable approach.
I am now a strong advocate for teaching percentages through visual, non abstract methods such as bar models, double number lines, pie charts and real life examples. I also build percentages knowledge through a step by step approach focusing on benchmarks like 1%, 10%, 50% and 25%. I’ve found that once my students understand these, the rest falls into place.
In this post, I’ll share how teaching percentages in small scaffolded steps using benchmarks from 1% to 100% can transform this challenging topic into something students not only understand but master with confidence.
Why Benchmarks Are Crucial for Understanding Percentages
- Benchmarks provide students with tangible reference points, for example 50% is half, 25% is one fourth, 10% a tenth.
- Benchmarks are easily relatable to real life examples, 50% (half) a pizza, 10% discounts, 25% battery life on an iphone.
- Difficulty levels increase gradually from simple to compound calculations helping secure understanding and build student confidence.
- It can strengthen mental calculation skills for percentages.
The Step-by-Step Approach to Teaching Percentages
Step 1: Explain the Meaning of Percentage, 100% as the ‘Whole Thing’ and 0% as ‘Nothing’ or zero.
Explaining that a percentage represents parts out of 100, with 100% signifying ‘the whole thing’ or ‘the total’ of all available parts and 0% representing none or zero, provides clear reference points. Once students grasp that 100% is the entire amount and 0% is none, they can more easily compare and visualize other percentages as portions of the whole.
I find a practical demonstration with a simple glass of water really helps understand 100% or 0% along with other real life examples (100% in a quiz, a whole pizza or birthday cake) as well as the traditional 100 square grid and bar models.
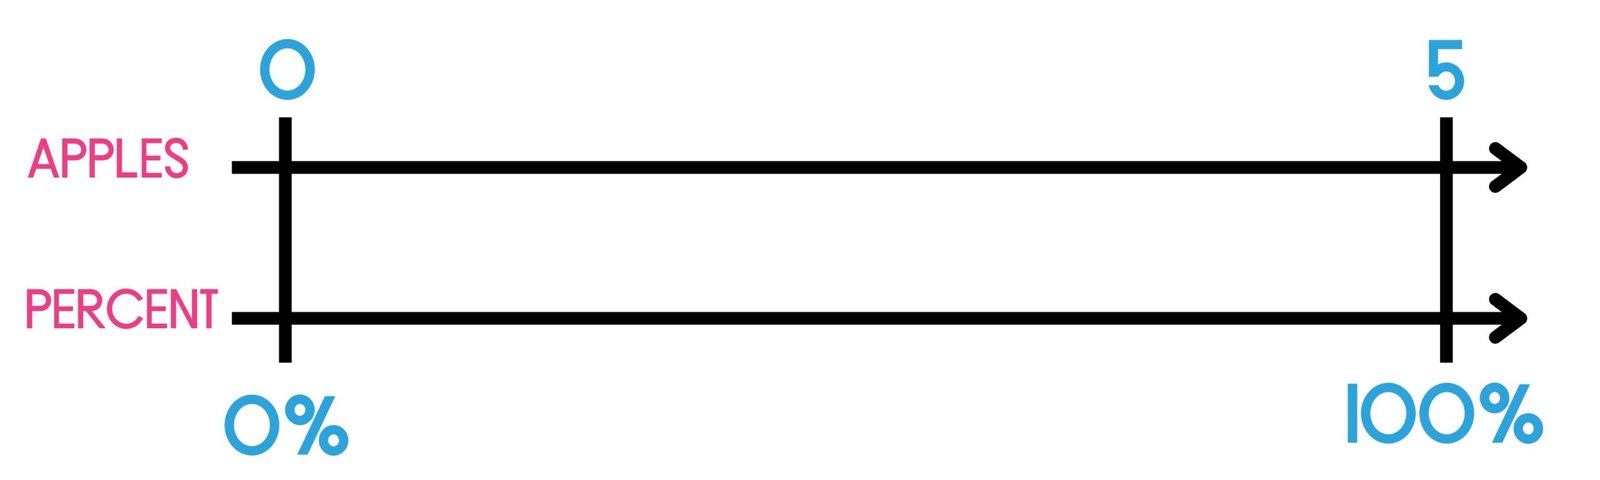
Finally I will introduce numbers, so for example, if I have 5 apples, so the total number of apples or 100% of apples = 5 and 0% = 0 apples. This is a great moment to introduce double number lines to help students see how percentages relate to numbers (see example below).
If you are looking for some pre-made percentage resources using double lines, check out the resources below in my store or click here.
Step 2: Start with the Most Manageable Benchmarks
Following the process above I move on to 50%. It is often the easiest for students (in my experience) to relate to in terms of being the equivalent of a half and really easy to demonstrate with practical examples, visual models, and then numbers. I then teach 10% relating to one tenth or 10 parts.
Step 3: Relate Benchmarks to Each Other
Next, I’ll focus on 1%, 25%, and 75% because they relate to the basic benchmarks from Step 2.
For example, to find 1%, you can either divide by 100 or use the relationship between 1% and 10%. To find 1% from 10%, simply divide the 10% value by 10, since 1% is one-tenth of 10%.
25% is one fourth or half of 50%
75% is three fourths of 50% + a half of 50%
Step 4: Practice Scaling Up
Once students are comfortable with basic benchmark percentages like 1%, 10%, 25%, 50%, and 100%, the next step is to help them use these benchmarks to calculate intermediate percentages (percentages that fall between commonly known benchmarks) through adding, subtraction, partitioning or multiplication.
In this step, the goal is also to help students see how percentages are used in everyday situations by applying what they’ve learned to real-world contexts, for example, savings and budgets, shopping discounts, fitness goals or recipes.
Example 1 (Addition): To find 15% of 80, combine 10% and 5%:
- 10% of 80 = 8.
- 5% of 80 = 4.
- Add the results: 8 + 4 = 12.
- Therefore, 15% of 80 is 12.
Example 2 (Subtraction) To find 45% of 80, start with 50% and subtract 5%:
- 50% of 80 = 40.
- 5% of 80 = 4.
- Subtract the results: 40 – 4 = 36.
- Therefore, 45% of 80 is 36.
Example 3 (Simple Multiplication)
Extend from 1% or 10%: Once students can calculate 1% or 10% of a number, they can scale up to find multiples of these percentages.
To find 3%, multiply 1% by 3
- 1% of 200 = 2.
- 3% of 200 = 2 × 3 = 6.
- Therefore, 3% of 200 is 6.
Example 4 (Partitioning) Split higher percentages into smaller, manageable parts.
To find 70% of 120, use 50% + 10% + 10% (or 2 x 10%)
- 50% of 120 = 60.
- 10% of 120 = 12.
- 2 x 10% = 2 x 12 = 24.
- Add the results: 60 + 24
- Therefore, 70% of 120 is 84.
Step 5 Build Mastery and Fluency
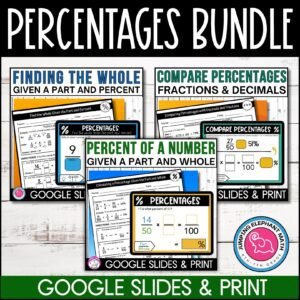
To help your students build mastery and fluency in calculating percentages, I’ve created the Percent of a Number: Find the Part or Whole Worksheets Practice and Test Prep. This comprehensive resource includes over 500 questions across 12 sets of worksheets, designed to guide 6th-grade students through the process of finding parts or wholes using benchmark percentages. From calculating 10%, 25%, and 50% of a number, to tackling percentages above 100%, these worksheets cover all the essentials.
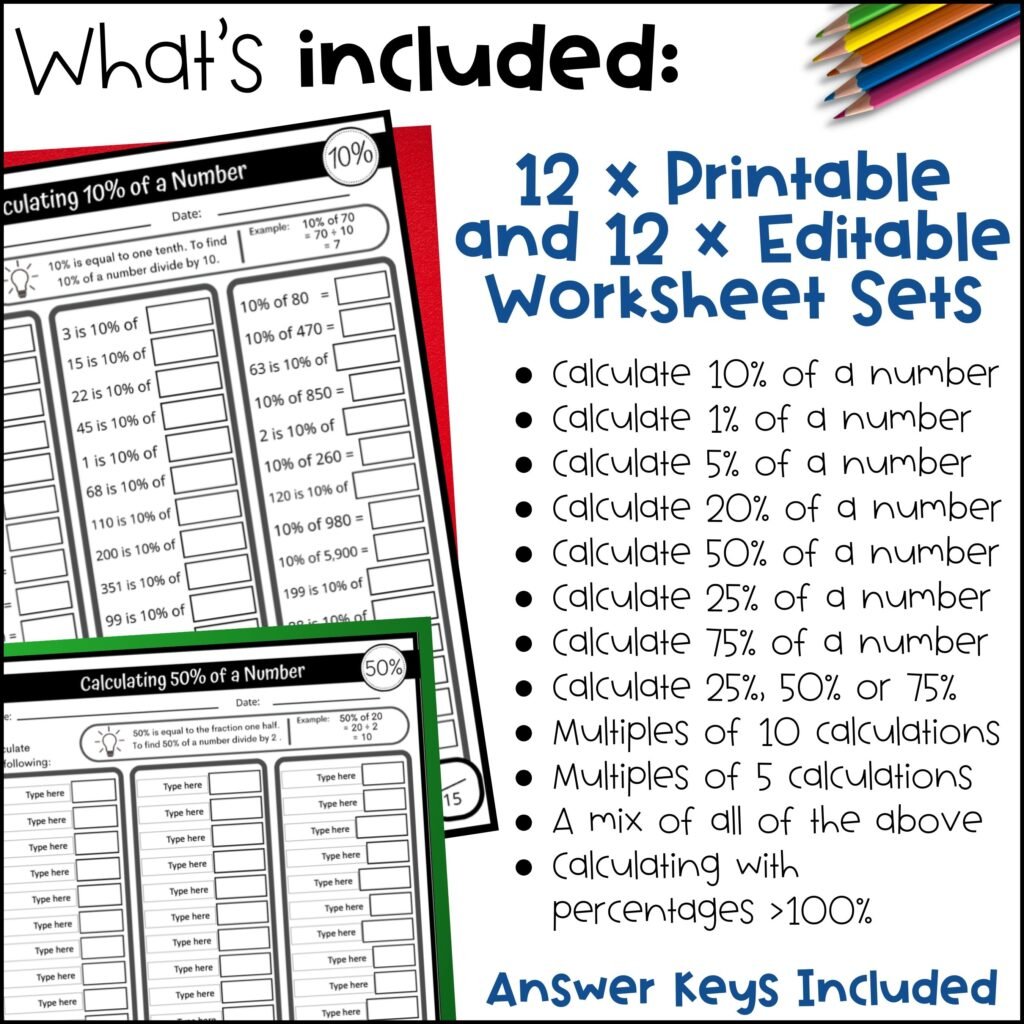
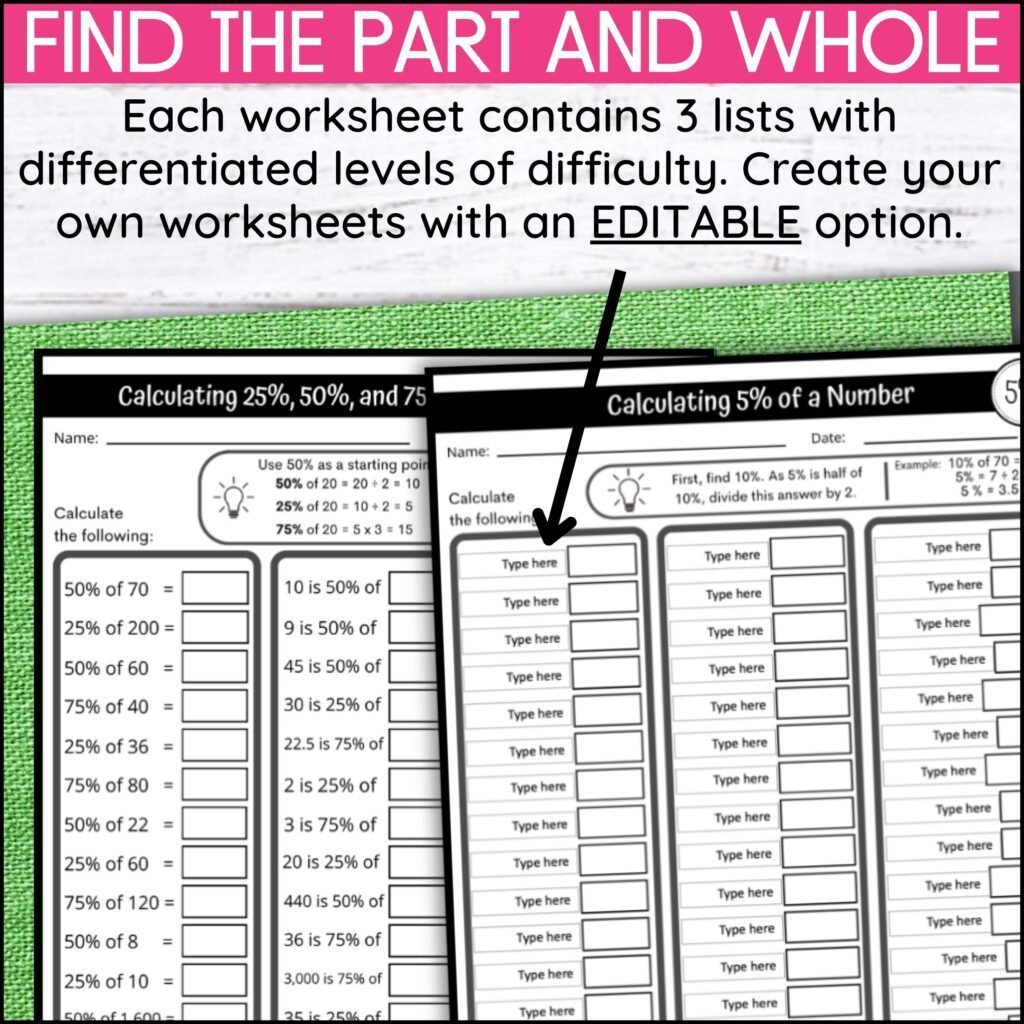
Each set is scaffolded to offer differentiated instruction, allowing you to adjust the level of difficulty for each student. Whether for test prep, homework, independent practice, or morning work, these worksheets will help your students build fact fluency and strengthen their understanding of percentages. With editable templates, answer keys, and step-by-step guides, this resource is the perfect tool to support your teaching and help students gain confidence in their math skills.
Other Resources to Support Teaching Percentages
Jumping Elephant Math resources are designed to meet the needs of a variety of learners and aligned with common core standards. Check out my full range of percentages resources here. For fun and engaging ideas for converting fractions, decimals, and percents, check out this blog post!